|
Click on the link below to find
the open access paper THE PHYSICAL PRINCIPLES ELUCIDATE NUMEROUS ATMOSPHERIC BEHAVIORS AND HUMAN-INDUCED CLIMATIC CONSEQUENCES
http://www.scirp.org/journal/PaperInformation.aspx?paperID=25758
It can also be accessed via the NASA-Harvard-Smithsonian
system at
http://labs.adsabs.harvard.edu/ui/abs/2012OJAS....2..302S
THERE ARE NO PARADOXES
AMONG THE
EVAPORATION,
RAINFALL, TEMPERATURES
AND RADIATION OVER THE LAST 50 YEARS
AND
THERE IS A NEW HYDROLOGICAL CYCLE
ERNANI
SARTORI
Brazil
Email:
e.solar@hotmail.com
ABSTRACT
In this paper, several unresolved
issues have been correctly solved and among them are: a) the misunderstood question on why in the last 50 years there was
more precipitation than evaporation in various parts of the world, which was known as the “evaporation paradox”;
b) the misunderstood question on why the evaporation in this period decreased while the ambient air temperature increased;
c) the misunderstood question on why in the last 50 years the surface solar radiation decreased while the surface (air
and water) temperatures increased. Fundamental theoretical concepts have been applied and all unresolved questions became
naturally solved. All measurements and data of radiation, rainfall, humidity, evaporation and temperatures obtained by different
sources are in agreement and confirm all analyses of this paper. Such measured data are not in agreement and do not match
with many statements and results from the established science on evaporation and related areas. In this
paper it is also demonstrated that there is a new hydrological cycle, which is the only theoretical proof that human
activities are responsible for the so called global warming and for the corresponding climate changes and their consequences.
INTRODUCTION
Recently, several measurements and analyses of data on the behaviour
of various parameters of the atmosphere in the last 50 years have been made (e.g., Peterson et al., 1995; Brutsaert-Parlange, 1998; Golubev et al., 2001; Liepert,
2002; Roderick-Farquhar, 2002, 2004). We can say that the common and most important conclusion drawn
from these and other correlated works refers to their authors´ misunderstandings on the results, which were then labelled
as paradoxes. The corresponding main unresolved issues by the established science on evaporation, related areas and global
warming studies are: a) the misunderstanding on why in the last 50 years there was more rainfall than
evaporation in various parts of the world, the evaporation-precipitation paradox; b) the misunderstanding on why the evaporation
in this period decreased while the ambient air temperatures increased, the evaporation-temperature paradox; c) the misunderstanding
on why in the last decades the surface solar radiation decreased while the surface (air and water) temperatures increased,
the radiation-temperature paradox.
If these questions remained unresolved, for not having the science the proper understanding
on the interrelated behaviour of the atmospheric parameters, the world would lose a lot of time, efforts, concerns, money,
direction and quality of life still for a long long time ahead.
However,
when fundamental theoretical concepts are applied to these situations all the supposed paradoxes disappear naturally and this
has been made in the present paper. Moreover, all measurements and
experimental data of the evaporation, rainfall, temperatures, radiation and humidity obtained by different sources around
the world (Peterson et al., 1995; Report DOE-ARESE, 1995; Golubev et al., 2001; Hansen et al., 2001; Liepert, 2002; Alexander et al., 2006) are in agreement with and confirm all analyses of this paper. Such measured data are not in agreement and
do not match with many of the corresponding statements and results from the established science on evaporation and related
areas (meteorology, climatology, hydrology, etc).
Therefore, in this paper large improvements
have been made for the correct understanding on the behaviour of the evaporation, of the greenhouse effect, of the global
warming and of the atmosphere itself, which informations are of enormous importance and put the corresponding existing understandings
en route for future developments, with special interest on the amelioration of the life on Earth.
ADDRESSING AND SOLVING THE INCONSISTENCIES
It has been reported that in the last 50 years the evaporation has decreased in various parts of the world
while in the same period and same places the rainfall has increased, and at the same time the corresponding air temperature
and cloudiness have increased (e.g., Peterson et al., 1995; Brutsaert-Parlange, 1998; Roderick-Farquhar, 2002, 2004). The
referred researchers as well as many others from the traditional science on evaporation expected that the consequence of this
air warming ought be an increase in the rate of evaporation from open water bodies, as well as they believe that more evaporation
is possible only with more precipitation, e.g., “reports of decreasing pan evaporation for the past few decades and
in different climates are hard to reconcile with well-substantiated increases in global precipitation and cloudiness”
(Brutsaert-Parlange, 1998). This trend has been observed in various parts of the Northern and Southern Hemispheres over the
last 30 to 50 years, but although can be considered general it did not happen in parts of Africa and other places (Roderick-Farquhar, 2004). Due to the contradiction between
their expectations and actual observations these facts were labeled as the “evaporation paradox”.
However, there is no paradox
between such evaporation-precipitation data as well as no disagreement between an increased air temperature and a decreased
evaporation rate! Figure 1 (Sartori, 1987, 1996), which correlates the influences of the atmospheric parameters and of the
water temperature with evaporation, clarifies all these issues easily. It is easily seen in Fig. 1 that with an increase in
TA the evaporation decreases and this effect is more pronounced for high RH. That is, an increase of the TA causes a decrease
in the evaporation, not an increase! This is the sensible heat influence of the TA on evaporation. Furthermore, it is known
that more rainfall increases the RH of the air, which on its turn decreases even more the evaporation, as also depicted from
Fig. 1. With higher TA in a sensible heating process the air is known to be drier because the corresponding RH is lower than
for the cooler air. This is the latent heat influence of the TA on evaporation. As seen in Fig. 1 it is the combination of
the TA, RH, V and TW that causes the evaporation reduction or increasing, and hence the effects of increased precipitation-decreased
evaporation are perfectly conciliatory! The consideration that only the latent heat effect exists when there is air warming
is an incomplete and erroneous understanding of the TA effect on evaporation, e.g., “one expected consequence of this
warming is that the air near the surface should be drier, which should result in an increase in the rate of evaporation from
terrestrial open water bodies.” (Roderick-Farquhar, 2002).
The established science
on evaporation, which is essentially based on the empiricism, considers the hydrological cycle to be dependent only on the
quantities of water and not that the air and surface water properties alters or regulates the velocity (and amount) of evaporation,
e.g., “…which would normally require more surface evaporation as the only source of atmospheric water vapour,
rather than less” (Brutsaert-Parlange, 1998). A reduction of evaporation does not mean that there is compulsory less
area for evaporation, but that the water evaporates less and not as fast as when there are low TA, low RH, high V and high
TW. Therefore, it is not mandatory that more rainfall needs more evaporation or more evaporation area. On the contrary, when
it rains the RH becomes higher and as a consequence the evaporation becomes lower. With a same area we can have more or less
evaporation, depending on the values of the atmospheric parameters and water temperature, as shown in Fig. 1. To limit the
amount of evaporation to the area really corresponds to a very limited understanding of the evaporation process.
It is also erroneous the
statement "decreasing pan evaporation actually provides a strong indication of increasing terrestrial evaporation (surrounding
environment)" (Brutsaert-Parlange, 1998). The evaporation of a pan or a lake, for example, depends on the atmospheric parameters
and water temperatures, and not on the evaporation of the adjacent land or water. At any instant, the RH of the air is a consequence
of all previous interactions and the corresponding result influences any evaporation of the next moment, being it from water
bodies or from soil and vegetations. The evaporations from water layers and soil
depend on the atmospheric parameters and on their own physical characteristics, and are independent from each other. When
the RH of the air is high, both evaporations, from water and soil will be slower and lower than with a low RH, and vice-versa.
This explains why the evaporations from pans and the surroundings in wet environments have both declined (Golubev et al, 2001;
Roderick-Farquhar, 2002) and these authors did not understand such fall. It is very elemental that two pieces of clothes put
side-by-side dry faster or slower according to the atmospheric conditions, not dependent from each other. When pan evaporation
decreases, the evaporation from the surrounding land or water surface also decreases, because these three systems are
submitted to the same atmospheric conditions, which correlation of parameters is seen in Fig. 1.
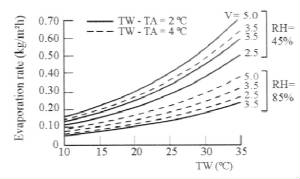
Fig.
1 – Various factors affecting evaporation from a free water surface.
Furthermore, the hydrological cycle cannot be taken as “precipitation
= evaporation”, as we learned in basic studies. In reality, for a selected system (control volume) at
the Earth’s surface the following mass balance forms the hydrological cycle in transient mode:
Rate of mass accumulation (at water, soil and
vegetation bodies) = Rate of mass in (rainfall) – rate of mass out (evaporation).
Thus, in places over the last 50 years where there was
high precipitation and low evaporation, there was an accumulation, or, the variation of mass accumulation was positive and
the places became more humid; in places in the same period where there was higher evaporation than precipitation, such
variation was negative and the places became drier. We can have different rainfall and evaporation rates in a same place in
different periods and conditions, or different rainfall and evaporation rates in different places of the world. It is absolutely
normal and natural to have variations in the rate of accumulation, due to variations in rates of precipitation and evaporation.
These rates are determined by the conditions or values of the atmospheric parameters.
The correlation of parameters in Fig. 1 is generated by an
equation of the form shown below (Sartori, 2000, 2003), which is based on the boundary layer theory, and comparisons of its
results with additional experimental data (Yu-Brutsaert, 1967) are shown in Fig. 2:
m = (0.00407V0.8L-0.2)
(Pw – Pd)/P
Fig.
2 – Comparison of experimental data for the systems 4B (L = 1.2 m) and 8B (L = 2.4 m) by Yu-Brutsaert (1967) with theoretical
results from the Sartori (1987, 2000, 2003), Penman (1948) and WMO (1966) equations.
For the sake of comparisons, the Penman (m = [(0.074 + 0.040V) (Pw –
Pa)]/hw) and WMO (m = [(0.0369 + 0.0266V) (Pw – Pa)]/hw) empirical equations have
been included in Fig. 2. For clearer comparisons, the original units of the experimental tests by Yu-Brutsaert have been kept
in this Figure.
Besides the natural behavior or the natural influence of the atmospheric
parameters on evaporation, there is another very important factor that makes the evaporation to change: the greenhouse effect!
The scope of a common greenhouse for rural or building application is to increase the inside temperatures, being the resulting
warming called by greenhouse effect. Sartori´s work (1996) is essentially a comparison between the thermal behavior of an
open evaporator, and the thermal behavior of a closed evaporator where the greenhouse effect happens. It is seen in that paper
that despite the higher water temperatures attained in a closed evaporator (solar still) the corresponding evaporation is
much less than that of an open evaporator of same area and under the same environmental conditions. That is, the greenhouse
effect causes the reduction of evaporation in relation to that of an open evaporator! The main reasons are the resulting more
saturated environment and high air temperatures inside the system.
The Earth’s atmosphere also owns a greenhouse effect that happens naturally,
where its gases, including the water vapor, have selective absorption properties similar to those of the glass, and which
process results in an average global temperature suitable for the life on Earth. If the planet did not have an atmosphere,
as in Mercury, its average surface temperature would be about –18 oC. However, some human activities have
significantly increased the concentration of certain gases and clouds in the atmosphere. As the concentration of these gases
and clouds increase, the surface, air and water temperatures must increase in order to maintain the energy balance between
the incoming and outgoing radiation. The water vapor and clouds play the
same role as the glass or plastic at any common greenhouse, where the heat is intentionally trapped inside the system in order
to increase the corresponding air, water or surface temperatures. The cloud cover also plays the same
role as the transparent covers, because water vapour has the capacity of trapping long wave radiation, and the well-known cloudiness increase
in the atmosphere in he last decades has contributed to the increase of the corresponding greenhouse effect. Thus, our atmosphere
is getting more and more “closed”, mainly in the second half of the 20th Century, which situation also explains
the evaporation decrease in the last decades in various parts of the world.
However, why the cloudiness has increased if evaporation has decreased
(in some parts of the world)? Here I inform that the evaporation is not the only source for the formation of clouds, and the
main reasons are: a) the emissions of tons and tons of particulates every second intensify the cloud formation, because droplets
of condensed vapor aggregate on microscopic dust particles and form clouds; b) the atmosphere has approximately a constant
amount of water vapor (~ from 0 to 4%), but tons and tons of superheated gases emitted by fossil fuel power plants and other
sources are released with temperatures that attain more than 1,000 oC, and then the air dew point temperature is
reached more often and more water vapor is condensed; c) the emissions also contain tons of water vapor and when they make
contact with cooler layers of the atmosphere more condensed water and clouds emerge; this item corresponds to latent heat
addition which also increases the RH of the adjacent air, which is another cause for the reduction of the evaporation. These
are also reasons on why the rainfall has increased in various parts of the world. Alexander et al. (2006) after analyzing
long-term data said that “precipitation indices show a tendency toward wetter conditions throughout the 20th century”.
Therefore, making the mass balance for a system (control volume) of the upper atmosphere, I found the new hydrological
cycle:
Rate of mass accumulation (clouds) = Rate of mass in (evaporation) + Rate of mass in (total
clouds and water vapor caused by artificial sources) – rate of mass out (rainfall)*.
The increase of the ambient air and water or surface temperatures
are well-known characteristics and behavior of any greenhouse and together with less evaporation in comparison to that of
an open environment (demonstrated in Sartori, 1996) represent proofs of the existence of the greenhouse effect. “It
is now well established that the surface of Earth has, on average, warmed ~ 0.15°C/decade over the past 50 years” (Roderick-Farquhar,
2002). It is also well-known that the global air and ocean water temperatures have increased in recent years, which is also
the case for the region of Campinas,
São Paulo, Brazil, as seen in the Table. From 1995 to 1999 the average air temperature was 17.4
°C, while from 2000 to 2004 this average increased to 18.4 °C. This increase coincides with the strong neo-liberal period
(1996-2006…) of installation of several and large fossil fuel power plants in that region and in the rest of the country,
a new situation for Brazil, which always depended on clean energies, mainly hydro. Furthermore, from 2000
to 2004 the surface insolation (in hours) in Campinas decreased 12 % in relation to that of the period 1995-1999, which corresponds
to a reduction of 48 minutes of insolation in 10 years. These data, this new hydrological cycle and this paper make
clear that humans have really been responsible for the increase of the greenhouse effect, of the global warming, and
for corresponding climate changes and their consequences.
Table – Average ambient temperature
for Campinas, Brazil,
during 1995-2004 with daily TA
measured at 7:00 AM (oC)
|
1995 |
1996 |
1997 |
1998 |
1999 |
2000 |
2001 |
2002 |
2003 |
2004 |
|
16.5 |
17.6 |
17.8 |
17.9 |
17.2 |
18.4 |
18.6 |
18.9 |
18.3 |
18.0 |
(Source: IAC-Instituto Agronômico de Campinas)
Roderick-Farquhar (2002) found “the cause” and stated that the evaporation
has decreased due to the reduction of the surface solar radiation resulting from energy losses by more clouds. This is a totally
wrong finding! First, the authors know that the air, surface and water temperatures have increased in the world, but didn’t
know that such rising is impossible with less energy in an open environment or atmosphere. These authors´ results violate
the First Law of Thermodynamics! The greenhouse works like a second energy source storing energy and raising the temperatures.
Second, if the Sun froze all temperatures on Earth would “freeze”, too, or would go below zero, including the
temperatures above mentioned, also considered by those authors. The pure empiricism on evaporation, which is not exclusive
of the paper mentioned in this paragraph, normally bases its analyses on isolated facts and on lots and lots of conjectures
without having the fundamental theoretical concepts from basic theories as guides for its analyses and thus very often
finds inaccurate explanations and solutions. When people analyze lots of isolated and variable facts without following secure
theoretical orientations to lead and support the assumptions and conclusions, they make such groups of data to become extremely
complex and thus accurate and reliable solutions are almost impossible.
A transparent cover (glass, clouds, plastic, water vapor, etc.),
of course, reduces the radiation entering the system (greenhouse) in comparison to that of a system that does not own a cover.
The gases CO2, CH4, N2O do
not have absorption bands for the visible part of the solar radiation spectrum while the H2O has some. Water vapor absorbs strongly in several bands of the more energetic part of the solar infrared radiation spectrum while
the CO2 absorbs in few and small bands of the less energetic part of this solar spectrum.
The
H2O concentration in the atmosphere
is about 100 times higher than the corresponding CO2 concentration and the infrared
radiation absorption of the H2O is much higher than that of the
CO2. The heat by evaporation and convection from the Earth’s surface is also
absorbed by the atmosphere and thus helps to increase the temperatures and the greenhouse effect. Moreover, a thicker and more opaque cover reduces still more the
transmitted solar radiation because the absorption of radiation in the cover is higher. Measurements confirming the reduction
of surface solar radiation in the USA and worldwide in the last decades have been made and showed that the surface solar radiation declined 19 W/m2 or 10% in the United States from the 1960s to 1980s and 7 W/m2 or 4% in other regions of the
globe in three decades (Liepert, 2002). However, Liepert (2002) did
not understand why reductions in surface solar radiation are simultaneous with an observed increase in surface air temperature
in the United States for the last three decades (Hansen et al., 2001) and concludes saying “more model simulations are
needed and strongly encouraged to explain the reductions of surface solar radiation”. Fortunately, the Liepert’s
expected strong and tremendously difficult task is already made and explained easily from Sartori (1996) as well as in the
present paper. The increasing of the water, surface and air temperatures along with decreasing surface radiation and decreasing
evaporation is possible only with the increasing presence of the greenhouse effect,
i.e., with the increased closing of the atmosphere, either in percentage and thickness of clouds as in their darkening. Other
measurements (Report DOE-ARESE, 1995) have also indicated that cloudy atmospheres absorb
50% more radiation than predicted, which result harmonizes with the measurements by Liepert (2002) and can be a confirmation
that the clouds are getting thicker and more opaque. The absorbed energy in a transparent cover represents a significant component
for the formation and increase of the greenhouse effect. The absorbed energy in a common sheet
of glass is much greater than in a thin sheet of plastic, and because of this the radiation entering the system with glass
is lower than for the greenhouse with plastic, but the greenhouse effect of the system with the glass cover becomes much stronger
than using this plastic. All measurements and experimental data obtained by different sources around the world (Peterson et
al., 1995; Report DOE-ARESE, 1995; Hansen et al, 2001;
Liepert, 2002; Alexander et al., 2006) confirm all analyses of the present paper.
While the clouds continue increasing in amount, thickness and darkness but can be still considered transparent, they
transmit radiation and augment the greenhouse effect and its inner temperatures, independent of the amount of energy reflected
by them. On specific days when the sky is fully covered by clouds and the surface radiation and air or surface temperatures
are low, the greenhouse effect is small and keeps up sufficient ambient conditions for the maintenance of the life on Earth.
On specific days when the sky is fully covered by clouds and the surface radiation and temperatures are high, there is a stronger
greenhouse effect and becomes harder to live in these ambient conditions. In a fictional limit case, where the sky would be
completely covered and opaque as well as “solid” due to the polluting solid particles in suspension, no energy
would be reflected and transmitted by this cover, the energy would be only absorbed and part of it subsequently transferred
by radiation emission and convection to the interior of the greenhouse. Then, the world would be like a closed box made by
brick walls without openings and windows, where the indoors would be more protected from the sunrays than in a greenhouse
with transparent cover, but the atmosphere would be warm, airless, humid and extremely harmful for the health, and the Sun
sensed by its warming effects and not by its colors, warming and movements**. However, I expect that in view of this panorama
the humankind will not let the world arrive to this point, because the processes of producing energy by fossil fuels and of
other intensive gas emitting industrializations and products should be gradually revised, the use and development of renewable
energies and of biofuels are rising steadily, and even nowadays there are available technologies that make possible the elimination
of the heat from gases as well as the reduction of their polluting and toxic effects. Goodwill and awareness are obviously
necessary.
** UPDATE: I wrote the above paper and “fiction” in May of 2006 and in the same month both were put on
the internet. It is amazing to announce that by the middle of August of 2006 happened a real fact that incredibly confirms
my description above. In the region of Rio Branco, the capital of Acre State, in the Amazon region, strong burnings happened and
the smokes invaded completely the city and remained in this way by about a week. Then, a reporter from a national TV network
went there and she reported the following facts: “the city is completely invaded by the smoke, the sky became overcast,
the solar radiation has reduced but the air is airless, warm and humid”. The reporter is from the SBT, or Record or
Band TV networks and the information above can be checked with them. It is really extraordinary the confirmation of my predictions
above through this fact!
NOMENCLATURE:
hw =
latent heat of vaporization of water, Jkg-1
L = surface length in the wind direction, m
m = evaporation rate, kgm-2s-1
P = atmospheric pressure,
Pa
Pa,
Pd, Pw = water vapor partial pressure at the air, dew
point and water temperatures, Pa
RH = relative humidity
TA = ambient temperature, oC
TW = water temperature, oC
V = wind velocity, m/s
REFERENCES:
1.
Alexander LV; Zhang X; Peterson TC; Caesar J; Gleason
B; Klein Tank AMG; Haylock M; Collins D; Trewin B; Rahimzadeh F; Tagipour A; Rupa Kumar K; Revadekar
J; Griffiths G; Vincent L; Stephenson DB; Burn J; Aguilar E; Brunet
M; Taylor M; New M; Zhai P; Rusticucci M; Vazquez-Aguirre JL (2006). Global observed changes in daily climate
extremes of temperature and precipitation. Journal of Geophys. Res., V.
111.
2.
Brutsaert WH, Parlange MB, 1998. Hydrologic cycle
explains the evaporation paradox. Nature, 396, 30.
3.
Golubev VS, Lawrimore JH, Groisman
PY, Speranskaya NA, Zhuravin SA, Menne MJ, Peterson TC, Malone RW, 2001. Evaporation changes over the contiguous United States and the former USSR: A reassessment. Geophys. Res. Lett.,
28, 2665-2668.
4.
Hansen JE, Ruedy R, Sato M, Imhoff M,
Lawrence W, Easterling D, Peterson T, Karl T, 2001. A closer look
at United States and global surface temperature change. J. Geophys. Res. 106, 23947-23963.
5. Liepert BG, 2002. Observed reductions
of surface solar radiation at sites in the United States and worldwide from 1961 to 1990. Geophys. Res. Lett.,
29/10, 1421-1433.
6.
Penman H. L. (1948). Natural evaporation from open
water, bare soil and grass. In Proc. Royal Soc. Lon., A193, 120-145.
7. Peterson TC, Golubev VS, Groisman PY, 1995. Evaporation losing its strength. Nature, 377, 687-688.
8. Report of the Department of Energy (DOE), 1995. Atmospheric Radiation Measurement
(ARM) Program, ARM Enhanced Shortwave Experiment (ARESE).
9.
Roderick ML, Farquhar GD, 2002. The cause of decreased
pan evaporation over the past 50 years. Science, 298, 1410–1411.
10. Roderick ML, Farquhar GD, 2004. Changes
in Australian pan evaporation from 1970 to 2002. Int. J. Climatol. 24: 1077–1090.
11. Sartori E, 1987. A mathematical model for predicting heat and mass transfer from
a free water surface. In Proc. of the 1987 ISES Solar World Congress, W.H Bloss, F. Pfisterer (Eds), 3160-3164, Hamburg,
Germany.
12. Sartori E, 1996. “Solar still vs. solar evaporator: a comparative study
between their thermal behaviors”. Solar Energy, 56/2, 199-206.
13. Sartori E, 2000. “A critical review on equations employed for the calculation
of the evaporation rate from free water surfaces”. Solar Energy, 68, 77-89.
14. Sartori E, 2003. “Letter to the Editor”. Solar Energy, 73/6,
481.
15. WMO-World Meteorological Organization (1966). Measurement and estimation of evaporation and evapotranspiration.
Working Group on Evaporation Measurement, Tech. Rep. No. 83, Geneva, 92 p.
16. Yu SL, Brutsaert WH, 1967. Evaporation
from very shallow pans. J. Appl.
Meteorol, 6/2, 265-271.
*The author of this paper has properly
registered the discovery of this new hydrological cycle.
The established science on evaporation and related areas (climatology, hydrology, meteorology, water
resources, etc.) fail too much in understanding and explaining several events on the atmospheric behaviour because these sciences
are characterized by an extreme empiricism, and thus, their treatment of the problems normally is not based on the available
fundamental theoretical concepts. Although such theories are universally known, surprisingly they are not adopted and
not followed by the above mentioned sciences, and thus the corresponding concepts not well known by them. As a consequence,
they fail too much on basic concepts and some of these are shown in my paper above as well as in the notes presented below.
As further examples, I can mention that some of their papers that
are based on the essence of their sciences were published by the Science Magazine violate the Laws of Thermodynamics, as well
as another of their main papers on the subject, which also found “the cause” for the evaporation “paradox”
and rendered lots and lots of media, prizes, medals, honors, status quo, etc. for their authors and was published by the Nature
Magazine, in reality solved nothing and contains only insanities and absolutely no physical meaning. Hence, it is tremendously
difficult for them to understand that simple problems (which, however, they consider to be enormous and complex), may
have simple solutions even if these are rigorously according to all universal theories and different measurements carried
out around the world, as shown in my paper. One of these most surprising difficulties is to see that they have a poor interpretation
on Fig. 1, as I could observe this through written discussions with some of them. In fact, modestly
I can say that my developments on this area represent considerable changes and modify the methods of thinking, calculation
and understanding of the evaporation process that exist since about 200 years ago.
On the other hand, it is very interesting to know that through my developments on the area of evaporation
I have unexpectedly found a scientific and proper method for the determination of the local effect of the global warming,
which has been considered by global warming studies as the “the big unknown”. Governments, institutions, organizations
and corporations wishing to know whether and in what degree their places are affected or not by the so called global warming
may contact me. As also shown in my paper above, I have easily found the new hydrological cycle, which is the only theoretical
proof that certain human activities are responsible for the so called global warming and its consequent climate changes. These
achievements never would be possible if only the related empiricist background was used.
Even so, I do not affirm that my development is absolute
and is free of eventual mistakes but I’m sure it is accurate on the bases of the known theories and is on the right
direction. Experts can make scientific reviews on my paper and send me comments, but please note that these will be published
here on the internet together with my rebuttals, if necessary.
Below I will present and
demonstrate one-by-one the several mistaken concepts that compose the essence of the established science on evaporation and
related areas, and make them to produce lots of inaccuracies and find erroneous solutions, even in simple situations. I will
not make this for personal reasons; I really consider that such background must come to an end, since it is erratic and thus
has the capability of solving nothing in many situations, and the 21st Century needs a more objective and more efficient science
than this one. I highlight that nothing has a personal character and everything serves for the benefit of the science and
of the mankind.
Fundamental errors of nine
of the ESERA essential concepts are demonstrated below:
1. Influence of the air temperature on evaporation. The established science on evaporation and related areas (ESERA) consider that increasing the air temperature
the evaporation increases. This is a tremendous error on a tremendously elemental concept and becomes unbelievable that entire
sciences still adopt such inaccurate concept. I will explain why. They know that the evaporation is directly proportional
to the pressure difference, that is, E ~ (Pw – Pa).
However, they certainly don’t know that the partial pressure Pa is function of the air temperature (dry bulb), exponentially.
Thus, when ta
rises, Pa increases
much more, and from the relation above we verify that the pressure difference reduces and then the evaporation decreases,
with Pw constant.
Such result is also shown in Fig. 1. This is the sensible heat influence of ta on evaporation, another concept not known or quoted by the ESERA.
2. Influence of the relative humidity on evaporation. Another inaccurate concept and its influence on evaporation adopted by the ESERA are related to the pressure
difference again and to the relative humidity. The evaporation is not proportional solely to the difference (Pw – Pa) as always considered by the ESERA, but to (Pw – Pd), where Pd = fPa, being f the RH, just as I modified the Bowen’s equation and demonstrated the accuracy of this modification
in my 1987 paper, my first on evaporation from free water surfaces. This new parameter, when correctly applied, has a fundamental
importance because it makes the relationship of the evaporation with the humid status of the air, which has never been done
by the ESERA. It gives the measure of the air humidity according to the air temperature. The mathematical model of the 1987
paper is a refined one, because it allows the calculation of all three situations that can occur when a free water surface
is exposed to the air, including the amount of dew (condensed water vapor) on the free water surface. This has never been
done before my publications.
Now I can give a numerical example of the influence of the
air temperature and of the relative humidity on the evaporation reduction. First, the air temperature. Let’s consider
a place that has a TA of 25 oC, a RH of 70 % and after some time this temperature rises to 30 oC. The
Pa for
25 oC is 3165.07 Pascal and Pa for 30 oC is 4239.65 Pascal. Keeping all other factors constant, the influence of a 5 oC
air temperature difference on the evaporation decrease is equal to (0.7 X 4239.65) – (0.7 X 3165.07) = 752.21. Now,
let’s verify the influence of a 5% RH difference on the evaporation reduction. Hence, keeping all other factors constant,
the influence of a 5 % RH difference on the evaporation drop is equal to (0.75 X 3165.07) – (0.70 X 3165.07) = 158.25.
That is, for the referred TA, RH and differences, the TA has 752.21/158.25 = 4.75 times more power or influence on the evaporation
reduction than the RH. This demonstration
can show how a world average air temperature increase of 1-2 oC (or even greater) may have contributed to the evaporation
decline in the last 50 years in some places. Furthermore, as cited in the paper, the Alexander et al. analysis of long-term
data shows that the atmosphere became wetter in the 20th century, thus also contributing to the evaporation decreasing. When
there is a combination of higher TA and higher RH, the evaporation is still smaller.
I can prove through several ways that the
evaporation has decreased in the last 50 years and that there are no paradoxes, and at the same time the people from
the ESERA still question themselves why the evaporation has decreased despite the air temperature and rainfall increase as
well as treat the physical phenomena generically.
3. Potential evaporation.
My questionings on the concepts used by the ESERA are not restricted to situations where the inaccuracies can be demonstrated
through calculations, but are also related to the concepts or parameters that are physically inexistent, incorrect, generic,
or have indirect use. Therefore, these concepts do not generate straight paths for finding the right solutions and accuracy,
and thus many of the solutions are not easily and correctly found, become inaccurate, unclear and not objective, because such
big amount of erratic things creates extreme complexity. Right ways are not easily found even when these are easy.
An example of an inexistent parameter
is the potential evaporation. Potential evaporation is a parameter that does not exist physically
and the ESERA know this. However, more incredible than this is the fact that they found equations to calculate a thing that
does not exist! From this understanding we can find two explanations: a) The calculation of a thing that does not exist correspond
to a procedure scientifically inexact; b) If we can find some exactness in these calculations we can say that what has been
calculated is not the potential evaporation, but solely the evaporation. Only evaporation corresponds to a real physical phenomenon.
We can analyze
step-by-step some of the several definitions given for potential evaporation and we will see that there isn’t a unique
or homogeneous definition for potential evaporation and also that they are not objectively described. From Wikipedia we have:
“Potential evaporation is defined as the amount of evaporation that would occur if a sufficient water source were available.
A dryland is a place where annual potential evaporation exceeds annual precipitation”.
Let’s analyze the first sentence. Sufficient for what? A generic definition,
not objective! Second: if a water source is not available, evaporation of water obviously does not exist. If evaporation does
not exist, any other name for evaporation also does not exist. Only evaporation can be calculated, doesn’t matter its
amount! Moreover, a place where annual evaporation exceeds annual precipitation does not mean necessarily that it is a dryland,
as can also be depicted from the definition. For example, it may be drier during the summer but not during the rainy season,
and the place is not recognized as a dryland. Thus,
the second sentence would be better written as “a dryland is a place where annual evaporation continuously
exceeds annual precipitation”. If the
maximum available water were evaporated, then the place would become drier and we could refer to the “total evaporation”
of the available water, not potential. Thus, for calculating the total evaporation we must take into account all the real
water volumes of some specific land. This calculation considers real data, not fictitious ones.
Other definition from a paper found on the internet: “The potential
evaporation, formally defined as 'wet-surface evaporation' is the evaporation governed by available energy and atmospheric
conditions”. I’m sorry, but this is risible. First: There isn’t evaporation if the surface is not wet! Second:
all evaporation in the atmosphere is governed by the available energy and atmospheric conditions! Despite this comic definition
which is a small example of the ESERA erratic concepts, it does not define potential evaporation, but only the evaporation.
The following definition from another paper seems to be clearer than others
shown here: “The evaporation from a surface with unlimited water supply is known as potential evaporation and it constitutes
the maximum possible rate due to the prevailing meteorological conditions. Thus potential evaporation is the maximum value
of the actual evaporation when water supply is unlimited”. From this definition it is confirmed that potential
evaporation is only a name created to take into account the evaporation of an unlimited amount of water. However, we can see
again that this corresponds to a strange consideration and calculation, because the calculation of an infinite evaporation
is a complete non-sense. Being it an unlimited or infinite source of water, when stops such evaporation (mathematically)?
Since the equations have mathematical limits, then the results do not correspond to the evaporation of an infinite amount
of water, but surely of a limited amount of water, which is nothing different than the well-known evaporation. The evaporation
of a big amount of water is not different than that of a small amount of water, it only corresponds to the repetition of evaporation
that happens every second. The evaporation can be given in kg/m2s, kg/m2h or even in mm/h, or other
units, and there is no difficulty in calculating it for another time span, if needed. That is, they think that they calculate
the potential evaporation, but they calculate only the evaporation, and this confirms again that potential evaporation does
not exist. They only lose time and efforts and generate complexity and prolixity when create lots of unnecessary terms. Potential
evaporation is a concept that can be deleted and the real world will not miss it.
From the AMS - American Meteorological Society we have: “Potential
evaporation – A measure of the degree to which the weather or climate of a region is favourable to the process of evaporation.
It is usually considered to be the rate of evaporation, under existing atmospheric conditions, from a surface of water that
is chemically pure and has the temperature of the lowest layer of the atmosphere”. Again and again we find inexactnesses
and complications in concepts produced by the ESERA. The first phrase simply means that when the place or day is dry, or windy,
or sunny the evaporation is greater, being smaller in opposite conditions. Furthermore, this ESERA definition and the corresponding
understandings that it generates to scientists and students are totally inaccurate and fictitious because up to now the ESERA
did not produce any kind of measure of the degree of evaporation according to the weather or climate. Even the relative humidity,
a very important parameter for the more accurate determination of the amount of evaporation, is rarely used by the ESERA,
and when used it is in no way applied for the determination of a “measure of the degree” of evaporation. As far
as I know only my Fig. 1 above gives a measure of the degree of evaporation according to the atmospheric conditions. The second
statement of the above ESERA definition is also totally and incredibly inaccurate, because ALL free water surfaces (including
pan and actual evaporation) submitted to the environment evaporate under existing atmospheric conditions, NOT only the “potential
evaporation”. Moreover, which is really “the temperature of the lowest layer of the atmosphere”, and where from the globe
is such temperature? And why the actual and pan evaporations do not
correspond to the temperature of the lowest layer of the atmosphere? The ESERA gave lots of names to
different evaporation situations without scientific justifications for this.
Since the existing concepts based on pure empiricism are very often insufficient
to explain their own problems, the ESERA created another term related to the evaporation called “apparent potential
evaporation” because the concept “potential evaporation” was insufficient to explain their lots and lots
of conjectures around a same situation, when only the real physical process called evaporation can explain everything related
to it. I will not comment on this “apparent potential evaporation” because it is a fictitious concept that comes
from a fictitious concept. With such lots of empirical concepts trying to describe a same situation and not following elemental
theories they only increase the complexity of the problems, make them more prolix, and as a result do not generate and motivate
a correct and clean understanding on many situations. It is also important to note that a “definition” must be only one that serves for every
situation, and not having lots of “definitions” and interpretations, as is the ESERA practice. When several
"definitions" are given for a same concept, this means that no one definition exists and only confusions and misinterpretations
result.
4. Actual evaporation. For any person not belonging to the ESERA it is tremendously hard
to discover the single and true meaning for “actual evaporation” and after exhaustive searches such concept still
remains in doubt. Almost certainly most or many of the ESERA researchers also do not have a unique understanding on this concept,
because as is the case for “potential evaporation”, there are lots of different definitions and interpretations
for a same concept, generating lots of different and divergent understandings according to the diverse situations encountered.
It is noted from various ESERA papers that the various authors also give their own definitions and interpretations when the
concepts “potential evaporation”, “actual evaporation”, etc., appear according to the new situations,
showing once again that this is not an accurate or scientific way to proceed.
Those who do not belong to the ESERA and by the first time make contact with the
very particular ESERA concept meaning that the pan evaporation is not real and there is another which is “actual”
or real have extreme difficulties to understand why, because the water of a pan is exposed to the same atmosphere as is the
water of a lake to which the actual evaporation is probably referred to. That is, both are real systems submitted to the same
real atmosphere, and the difference is only the size of the reservoirs. May be the ESERA understand that a pan is not permanent
while the lake is, then this may be the reason to call one by actual and the other by pan evaporation. However, before we
can be aware of this possibility, these denominations cause tremendous confusions and remain inaccurate because to be real
an evaporation system needs only to be submitted to the real environment and to be a real or actual evaporation the system
should not be related to the exposed time or to the sizes of the water surfaces. An evaporation of one second of exposition
to the real environment and of one square meter is as real or actual as one year of exposition of a water surface of one square
kilometre. Thus, instead of saying “actual evaporation” it would be more correct and accurate to refer only to
“lake evaporation”, “pond evaporation”, etc., to differentiate from pan evaporation. Although the
size and time of exposition alters the evaporation, it is normally given by unit of area and unit of time, that is, kg/m2s,
or, if desired, in kg/m2h, which units make the evaporation not be evaluated and compared by the size of the reservoirs.
When it is desired to express the evaporation by the total area or by the total time of exposition we need only to multiply
the units given above by the total area and total time for specific cases. This is a much simpler procedure than to create
a formula for a small quantity of water, other for a large body of water, another for the maximum quantity of water, and still
another for a minimum quantity of water, and so on, as is the regular ESERA modus operandi.
After strong efforts we understand that the ESERA created differences as well as
several and prolix concepts to define different amounts of evaporation, a non-sense and not objective practice. Therefore,
when only the term evaporation and its units given above can explain and resolve any amount of evaporation, the ESERA created
terms like “potential evaporation”, “apparent potential evaporation”, “actual evaporation”,
“pan evaporation”, “equilibrium evaporation”, and may be others for representing different amounts
of evaporation. Moreover, the ESERA is not clear enough and do not specify what amount of evaporation corresponds to each
name, and again we see that it is not a scientific or accurate method.
However, after lots of neurons lost in search for a reasonable and more
objective meaning for “actual evaporation” we discover that: Actual evaporation @ 0.7 x pan evaporation. Although this can be an acceptable way to convert the
evaporation from a pan to that from a lake, even so this normally does not correspond to a more accurate way. The coefficient
0.7 is an approximation that is often used randomly, and normally does not reflect specific cases. The evaporation from a
pan is normally obtained in a site with some specific weather but the lake evaporation to which the pan evaporation will be
related with was obtained in other place and even in other country with other weather and physical conditions, as proves the
following note withdrawn from a known paper: “Unfortunately,
parallel pan and actual evaporation data were only available at one U.S.location”. Hence, instead
of 0.7 this coefficient could vary from 0.1 to 1.0 and nobody really knows which one of these values is the more accurate.
When we think that we have finally found the definitive definition or
relationship for actual and pan evaporation we find others that restart and increase the confusions. For example, from the
AMS glossary we have: “actual evaporation—Quantity
of water evaporated from a region comprising open water or ice surfaces, bare soil or vegetation-covered soil”. Thus,
we may ask: Is the pan coefficient 0.7 related to the evaporation from only one lake of such region or from all the water
surfaces of that region? Please note that the definition above refers to “quantity” of water, which means total
water evaporated (in kilograms or litres) and does not refer to the evaporation rate (in kg/m2s or even in mm/h)
from that region. So, how can the total quantity of water evaporated from all lakes of a region (millions of litres) be related
to the evaporation of a small quantity of water from a pan by a number like 0.7? The formula “pan evaporation = actual
evaporation/0.7” for millions of litres of actual evaporation will never correspond to the quantity of water of a pan.
Here again we find tremendous lack of accuracy and confidence on definitions secularly adopted by the ESERA and supported
by their academic journals.
Furthermore, lots of discussions and doubts on the real meaning of the
relationship between pan and actual evaporation are easily found in papers, such as the following: “Based on data from a similar climate type in the former USSR, the decrease in pan
evaporation reflects an increase in actual evaporation”. Since the pan is normally used for obtaining a measure of the
evaporation from a lake and the ESERA established a mathematical relationship between actual and pan evaporation by the equation
“actual evaporation = 0.7 x pan evaporation”, this means that when the pan evaporation
increases the actual one must increase, too, or when the pan evaporation decreases the actual one must decrease, too. Therefore,
we arrive at two possibilities: a) this ESERA mathematical relation is invalid; b) if this mathematical expression is valid,
then the above ESERA statement has no sense and they are discussing and producing foolish things
and want to make us completely crazy.
We also find in other papers that “potential evaporation = 0.7 x pan
evaporation”, and from which relation we conclude that “potential evaporation = actual evaporation”. However,
from other paper we read “By definition actual evaporation is less than or equal to the current potential evaporation,
where potential evaporation is the rate at which water would evaporate from a free (lake) water surface”. The mathematical
relationship above only allows that potential evaporation be equal to actual evaporation and nothing different from this!
The ESERA are not aware on the lots and lots of insanities they produce and on the lots and lots of inaccuracies that such
things generate and extend to years and years ahead.
The quantity of the ESERA confusions and inaccuracies on a same concept is endless:
“Actual evaporation is the amount of water which is evaporated a normal day which means that if for instance the soil
runs out of water, the actual evaporation is the amount of water which has been evaporated, and not the amount of water which
could have been evaporated if the soil had had an infinite amount of water to evaporate”. What is a normal day? A "normal"
day from cold regions, from summer days, a "normal" windy day, from northern or southern hemisphere, humid?
Which are exactly the values of the atmospheric parameters that define such "normal" day? Furthermore, to exist evaporation
the soil or water surface must have sufficient water, otherwise the evaporation obviously ceases. Moreover, the evaporation
from a small or limited water reservoir is as real or actual as the evaporation from a huge amount of water.
Despite all of these insanities and inaccuracies, there is a good point. The
approach of saying that the lake evaporation is normally less than the pan evaporation is somewhat in agreement with the boundary
layer theory, as shown by Sartori (2000), who demonstrated that the evaporation per square meter decreases as the length of
the water surface in the wind direction increases, as is also seen through the Sartori equation given in the paper above.
5. Equilibrium evaporation. From a paper we have the following interpretation for the equilibrium evaporation: “The equation above
is the equilibrium evaporation rate. Under these conditions it has been interpreted as the lower limit of potential evaporation,
since this equation represents the minimum possible evaporation from a saturated surface. In this instance the evaporation
flux is independent of wind speed, depending solely on temperature and available radiant energy”. Following the ESERA
procedure for naming the evaporation according to its different levels we can see that equilibrium is the name for the “minimum
evaporation from a saturated surface”. Even so, it is impossible to differentiate clearly between two amounts of evaporation.
On the other hand, the last phrase of this definition gives the notion that this corresponds to the evaporation when there
is free convection since such resulting evaporation depends on the air temperature whenever there isn’t a sufficient
wind velocity. However, in no way we can say that it corresponds to equilibrium, because it is not, especially in an open
environment. Although it is comprehensible that the evaporation science started in the 19th Century, times of empiricism
and when the theoretical knowledge and comprehension on the evaporation processes were in their beginnings, all of the ESERA
concepts continue till to date with no modifications and, as in the present case, when the free and forced convection are
already well known processes since a long time ago.
6. Parametric
dependence. In the item 5 above, we can find another of the inaccurate ESERA essential concepts.
As said above and normal in the ESERA definitions and interpretations “the evaporation flux depends solely
on (water) temperature and available radiant energy”. This is also a strong erroneous understanding (also included in
ESERA equations) of the evaporation process, because the water temperature and the solar radiation are not independent parameters,
that is, the solar energy is a cause and the water temperature a consequence. Any temperature attained by the water is a consequence
of all heat gains and losses with the environment, including the solar energy. Thus, it is erroneous to say that the evaporation
depends on both parameters. The evaporation depends on the water temperature during the day as well as during the night.
7. Wind velocity and length in the wind direction. Contrarily to the background
of the ESERA, the evaporation and convection are not linearly dependent over the wind velocity and over the surface length in
the wind direction (Sartori, 2000, 2003, 2006). I do not consider insanity that up to now these parameters
have not been employed correctly by the ESERA, because I take into account that the current knowledge about their
behaviors and effects represent a consequence of the science’s natural evolution. However, even with this in mind, their
incorrect utilization leads to inaccurate results. Although Sartori (2006) is for dry surfaces, all of its principles
are the same as those for the evaporation, and thus both papers (2000 and 2006) should be read and are essential
for the comprehension of the evaporation process. Both parameters come from the boundary layer theory and whenever there is
a fluid flow over dry or wet surfaces, wishing it or not, such concepts are mandatory present, and therefore, not using
them conducts to inaccurate answers. Moreover, the traditional empirical equations on evaporation and convection heat
transfer are not supported by any existing theory and suffer influence from statistical processes. Only Sartori has demonstrated
this and in view of his works the corresponding traditional papers on evaporation and convection became obsolete. Thus, considering
that the world is already aware of this development, to continue using such traditional empirical equations, or worst, insisting
to create new ones of the same erroneous type really represents a strong insanity, in my point of view.
Sartori E, 2006. Convection coefficient equations for forced air flow over flat surfaces.
Solar Energy, 80/9, 1063-1071 (Top 25 Hottest Articles of the Solar Energy Journal).
8. Pan versus lake evaporation. Only two parameters are sufficient to differentiate
the evaporation between these two systems: the size and the water temperature. The sizes are represented by the length L in
the wind direction (Sartori, 2000. 2006) according to the boundary layer theory, which is mandatory present in every fluid
flow over any surface. The water temperatures are very different in both systems. Due to the high thermal inertia, the water
temperatures of a lake are much lower than those of a pan during the day. Since the evaporation is a strong function of the
water temperature (see Fig. 1 of the paper above), the pan evaporation is much higher than the lake evaporation. These two
parameters are fundamental to make both evaporations to differ enormously from each other. Surely, they are not
taken into account in the ESERA procedures for the adoption or application of pan coefficients and then such practices represent
further weak points of their empirical methods for obtaining lake evaporation. With this simple analysis we can immediately
verify that the normal direct and indiscriminate application of some values of pan coefficients generate lake evaporations
completely erroneous. Item 9 presents additional understandings on how the ESERA common pan coefficient values have produced
strong inaccurate estimations of lake evaporation rates.
9. Pan coefficient. This coefficient is used to estimate
lake evaporation when the pan evaporation is known. However, as we will see in this topic, the ESERA estimations of lake evaporation
have remained very far from the most exact evaporation rates. Their most common values and intensively repeated in the ESERA
literature are 0.7 and 0.75, although values higher (including those greater than the unity) and a little bit lower than these
are also found. As always, I will analyze these values based on elemental physical principles and scientific procedures. First
thing to be said: in reality, these pan coefficient values worth nothing and this can be stated because the evaporation from
lakes has been rarely measured directly and was never measured accurately. Measurements like those by Sene et al. referenced
in Sartori (2000) do not correspond to a measurement of the lake evaporation, but only from a part of it, due to the evaporation
dependence on the length in the wind direction. Therefore, the ESERA pan coefficient values do not correspond to a relationship
between a measured evaporation to another measured evaporation because the lake evaporation is always estimated, which situation
makes us to consider that these pan coefficient numbers may not be as accurate as desired.
Basically, the ESERA make use of three methods for utilizing or obtaining
the pan coefficients: 1) Simply and indiscriminately employing the most common values of 0.7 or 0.75; 2) Taking pan coefficients
estimated by someone else from a certain lake and applying them to different physical and weather conditions of another lake
very far from that; 3) Trying to obtain pan coefficients from empirical methods (which intrinsic and strong inaccuracies are
demonstrated in Sartori, 2000, 2006) such as the Penman equation. All of these three methods generate erroneous values for
the pan coefficient and this can be so easily stated simply because the lakes have different water temperatures and sizes
in relation to other lakes or to evaporation pans, as explained above.
Such inexactnesses can be shown through
numbers, too. The Sartori’s equation shown in the paper above can be used for this. Sartori’s equations are the
only ones that consider the length L, which means that they can be applied to surfaces of any length. The level of accuracy
of his equation for evaporation compared directly with real experimental data is shown in Fig. 2 of the paper above. Further
verification of the high level of accuracy of the Sartori’s equations for flow over flat surfaces is seen in Sartori
(2006). (The level of inaccuracy of the Penman equation is noted in Fig. 2, too). Then, we can expect that the accuracy of
the Sartori’s equation for evaporation is equivalent both for a pan and for a large lake.
Let’s
consider a numerical example. A pan, a soil and a lake together are submitted to the same weather conditions and the three
corresponding temperatures increase or decrease at the same times, according to the presence or absence of solar radiation,
contrarily to what the ESERA absurdly think.
So, applying the following Sartori equation (I recommend to use this equation
for all situations, i.e., for small and large water bodies)
Ev = 0.00407V0.8L-0.2(Pw – rh x Pa)/P
for a pan and a lake we will know now by the first time ever the correct magnitudes of
the relationship between lake evaporation and pan evaporation and consequently the realistic pan coefficient values.
Hence, let’s consider tw = 40 °C, L = 1.2 m
for the pan, and tw = 30 °C, L = 1,000 m
for the lake. The other required variables are: ta = 25 °C; rh = 0.70; V = 3 m/s; standard atmospheric pressure. With
such conditions we obtain Evpan = 0.00048075 kg/m2s and Evlake = 0.00004918 kg/m2s.
Hence, the ratio of the evaporation of a lake to that of a pan is
Coeff = Evlake/Evpan = 0.00004918/0.00048075 = 0.10!
This result shows us that the magnitude of the pan coefficient should be about
0.10 for these common conditions and cannot be much higher than this number. For Llake = 100 m
and the same conditions, this coefficient rises merely to 0.16. If the water temperatures of both systems are the same, this
coefficient increases only to 0.26. If the sizes are the same and with the above conditions this coefficient becomes 0.39.
With these normal conditions, values of 0.7 or 0.75 or higher cannot be got. A coefficient of 0.75 would be obtained if the
"lake" had L = 5.0 m and tw = 40 °C. Only when the lake water temperatures are higher than those of the pan (normally
at night or soon in the morning) this coefficient becomes higher than the unity, but the water temperatures and evaporation
rates in such periods are very low, and sometimes happens the opposite situation, that is, condensation of the water vapor
of the air onto the water surface (Sartori, 1987, 1996, 2000). I regret to inform that the ESERA pan coefficients have remained
very far from the most realistic values.
These considerations and results confirm what I suspected some years
ago. If the ESERA equations have been used to predict the amount of water on the planet, the present values indicate that
there is much water on the Earth’s surface than has been estimated till to date.
__________________________________________________
This section is used to show how the
ESERA concepts and procedures demonstrated above also belong to the science on global warming and how they have affected the
correct understandings and solutions for the problem.
1. It is well-known that the IPCC states that
the CO2 is the main greenhouse gas and that its continuous increase in the atmosphere increases the Earth greenhouse
effect and thus the global warming. Therefore, if this substance increases then its potential to cause damage also
increases, it seems obvious, isn´t it? However, for the IPCC this is not obvious, and worst, it is opposite to this: the
GWP (Global Warming Potential) for the CO2, established by the IPCC, is always and forever constant and equal to 1! Hence,
one of the two statements or understandings is incorrect! While the IPCC calculations and simulations always consider
a permanent GWP equal to 1 for the CO2, in its statements the atmospheric potential of the CO2 always increases.
Absurd!
__________________________________________________
ATTENTION PLEASE! WORLD DENUNCIATION!
This site started in May of 2006, and as normal, few days after its web publication, it appeared in the first four to
ten Google and Yahoo results when simple search keywords like "evaporation paradox", "there are no paradoxes", "evaporation",
etc., were used. Since then this site showed a very interesting amount of visits daily. However, in October 2006 surprisingly
I discovered a situation that now is known to happen on the internet and which probably is unaware by most of the world. Such
fact clearly shows some kind of behaviour of at least these two famous search engines: truculent and dictatorial power
abuse! Their attitudes will be known by the world and the people will at least change the former image on Google and
Yahoo. Only few days after the paragraph commenting on the erroneous definitions of concepts adopted by the AMS-American Meteorological
Society was included in the document above, the Google and Yahoo simply eliminated completely my site from their results.
Now, even using lots and lots of different keywords, this site does not appear in any of the Google and Yahoo search results.
The proof of this truculent elimination can be obtained simply by putting this own site address http://noparadoxes.tripod.com as the keyword for Google and Yahoo and we can see that the site link or address does not appear. These are anti-democratic
attitudes that do not match with the scopes for the internet, and the world must be aware about this. These tyrannical Google
and Yahoo attitudes are still more repudiated because this is a scientific site for the complete benefit of the science and
of the humankind and Google and Yahoo understand nothing about this science and thus they actuate against all the
science and the humankind. I reaffirm that this space is completely free for those who may not agree with my scientific
statements, but till to date absolutely no comment was received. Google and Yahoo are making censorship on the internet, and
worst, a private scientific censorship on matters which they are unaware. I can add that my document above represents "inconvenient scientific truths". The world population as well as legislators must
be aware of such totalitarian attitudes, otherwise all of you can imagine in what will be transformed the internet world.
I have some news. Today is
27 December 2006 and I have just discovered that now the link for this site appears only in the Google results when
its own address is used as the keyword. However, the link to this site for other keywords as mentioned above continues
not appearing in the search results. Thus, the situation continues the same as denounced above because nobody knows an
address which is being searched.
More news. Today is 05 January 2007 and
it seems that Google restored the search results to the former situation, when the keyword "evaporation paradox" showed
the link to the site "noparadoxes" in the first positions. Now it is on the 1st-3rd page. However, Yahoo restored absolutely
nothing.
|